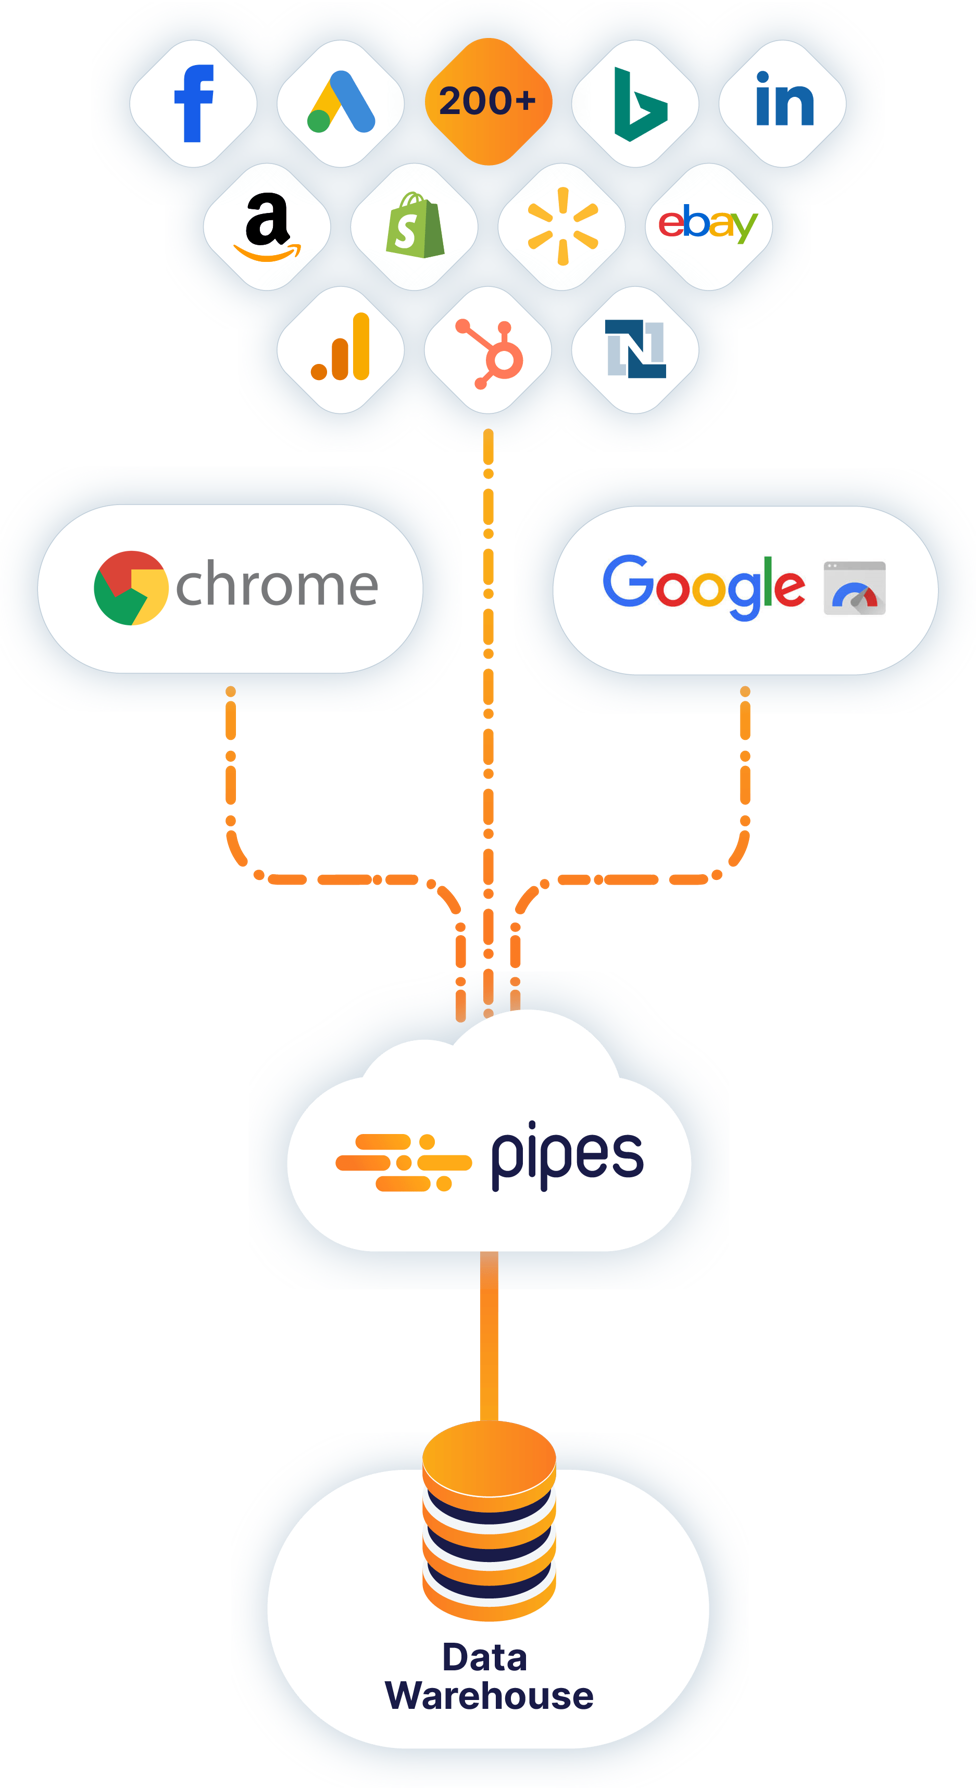
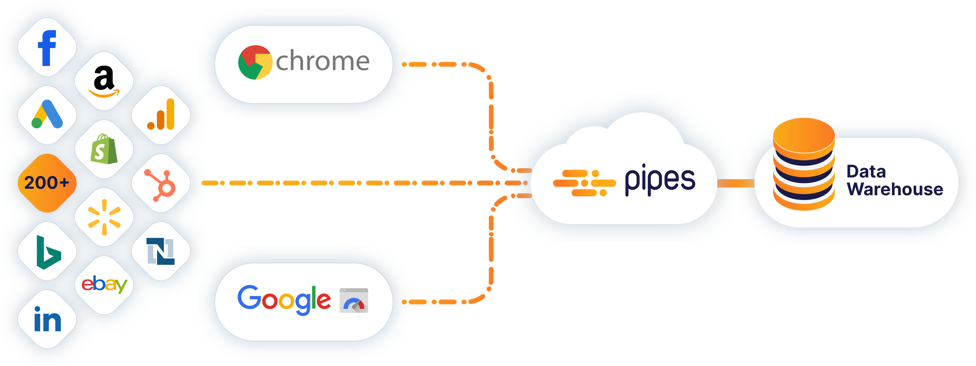
Load data from Chrome UX Report and Google PageSpeed Insights API into your central data warehouse to analyze it with the business intelligence tool of your choice.
Use Cases
Explore how you can use Pipes in different scenarios.
Learn
Learn more about Pipes with customer stories, useful blog posts and the documentation.
Customer Case Study
Boosted Commerce automates all data integration processes with Pipes Professional.
Customer Case Study
SM Nutrition saves resources and costs through a lean inventory management.
Documentation
Read through the Pipes documentation here.
Blog
Find useful guides and further informative articles in our blog.
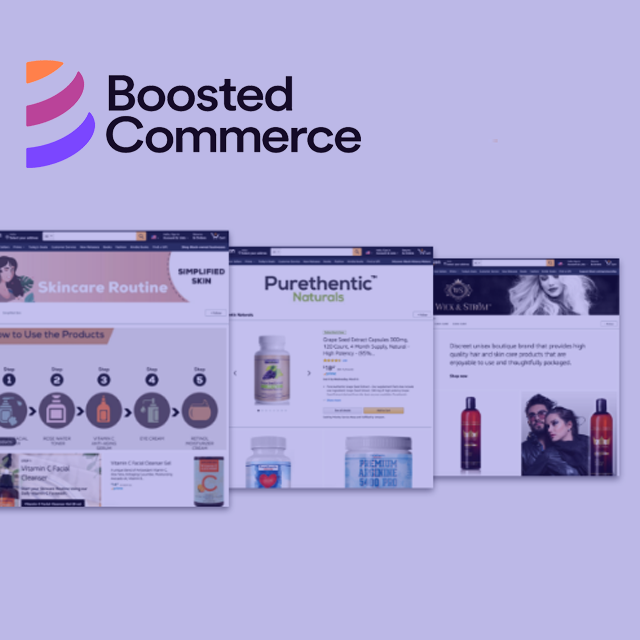 Customer Case Study: How Boosted Commerce automated all data processes
Learn how Boosted Commerce quickly evolved into one of the world’s largest brand aggregators by automating all data integration processes with Pipes Professional