How to combine data from IBM Informix with Chrome UX Report

Pipes allows you to quickly Integrate IBM Informix with Chrome UX Report data for a combined analysis.
Load data from IBM Informix and Chrome UX Report into your central data warehouse to analyze it with the business intelligence tool of your choice.
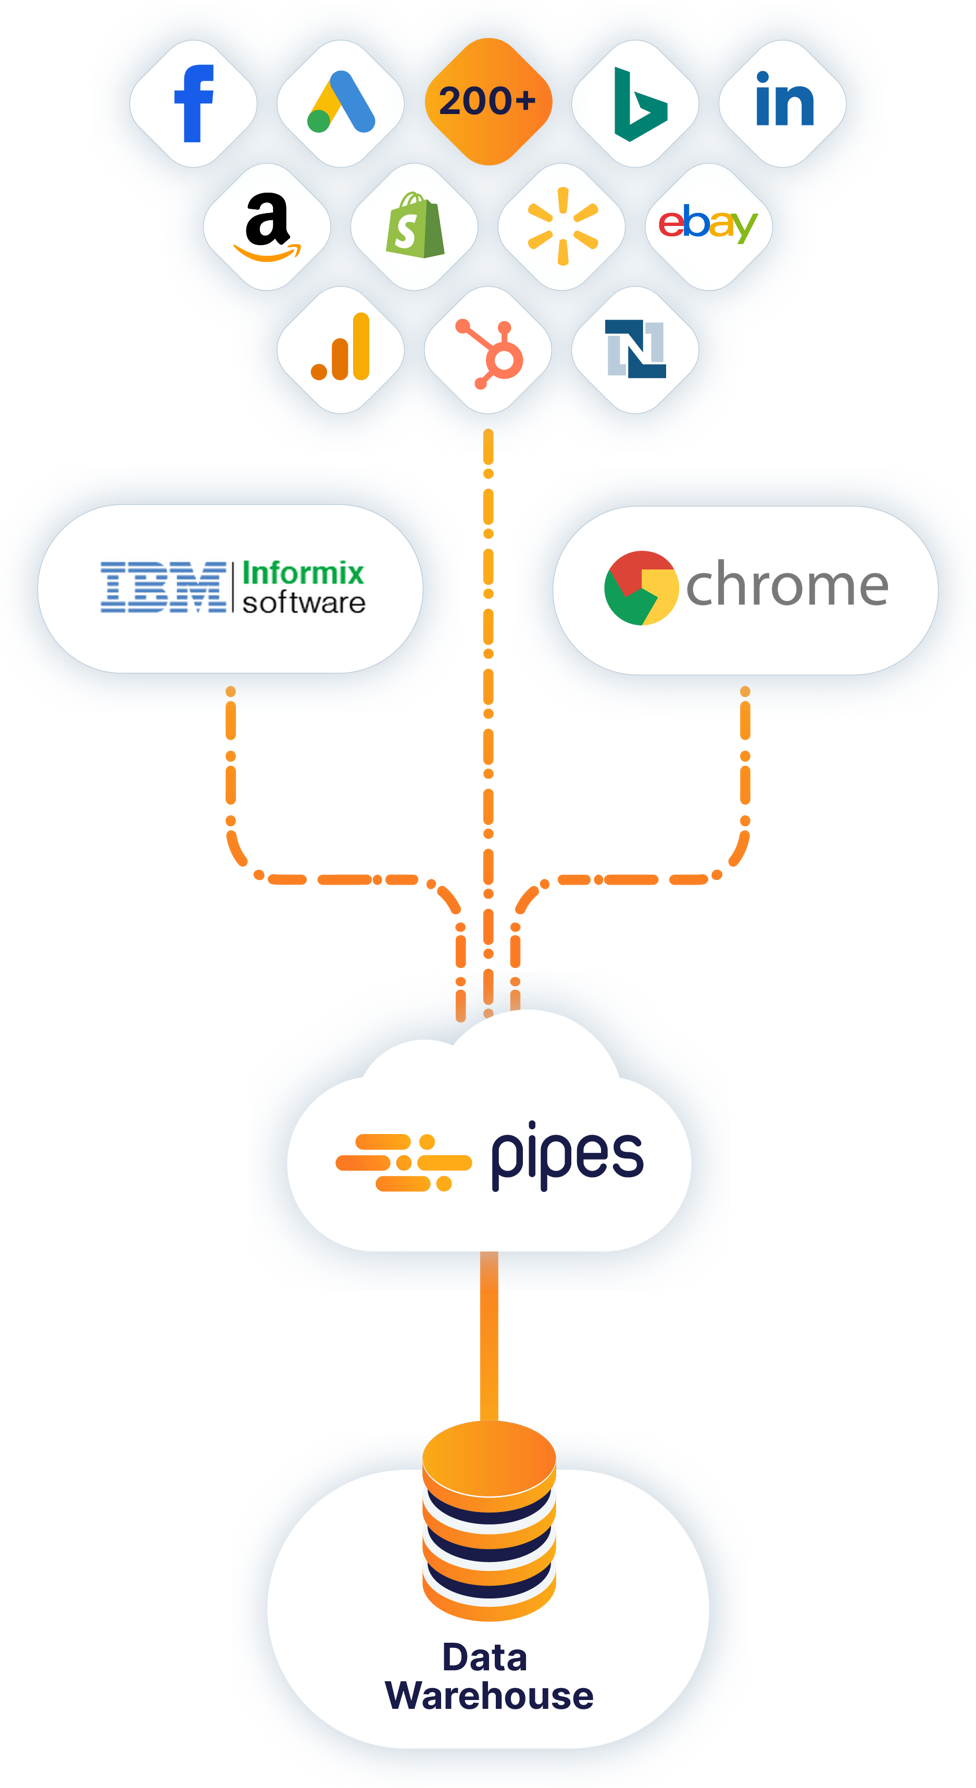
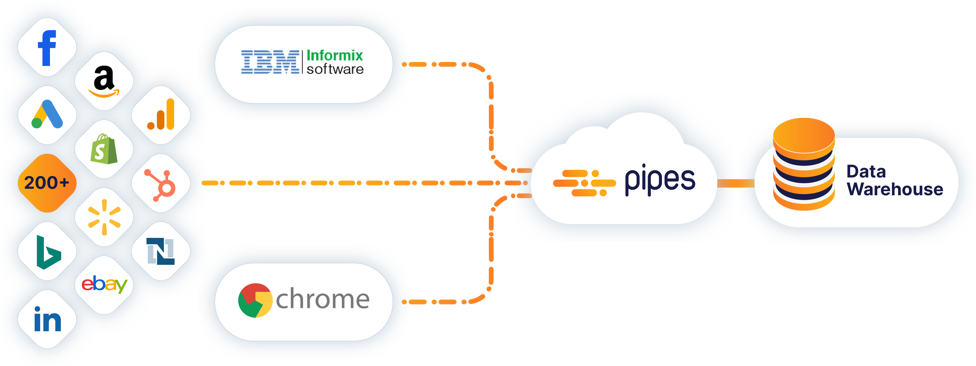
Pipes allows you to connect to IBM Informix, Chrome UX Report, and more than 200 other APIs, web services, and databases with ready-to-use data connectors. Automate your data workflows through data pipelines without a single line of code.
1

Connect your data warehouse

It will be the destination of all data pipelines you build. Pipes supports relational databases in the cloud and on-premises.
2

Connect to IBM Informix and Chrome UX Report

You just need to enter the associated credentials to allow Pipes access to the IBM Informix API and the Chrome UX Report API.
3

Combine data from IBM Informix and Chrome UX Report

Pipes lets you select the data from IBM Informix and Chrome UX Report that you want to load to your data warehouse. These data pipelines will run automatically on your defined schedule!

About IBM Informix

IBM Informix is a product family within IBM’s Information Management division that is centered on several relational database management system (RDBMS) offerings. The Informix server supports the object-relational model, which has permitted IBM to offer extensions that support data types that are not a part of the SQL standard. The most widely used of these are the time series and spatial extensions, which provide both data type support and language extensions that allow high performance domain specific queries and efficient storage for datasets based on time series and spatial data.

About Chrome UX Report

Google’s Chrome UX Report (CrUX) is a revolutionary resource that provides comprehensive insights into user experiences on websites, detailing key metrics and user interactions. Chrome UX Report empowers developers and businesses to fine-tune web applications, optimizing performance, and user satisfaction. By leveraging the UX Report alongside our corresponding Chrome UX Report API data connector, users can seamlessly access, integrate, and visualize real-world user experience data, enhancing the ability to make informed decisions and implement effective enhancements on their digital platforms.

Your benefits with Pipes

Get central access to all your data

Access data from 200+ data sources with our ready-to-use connectors and replicate it to your central data warehouse.

Automate your data workflows

Stop manually extracting data and automate your data integration without any coding. We maintain all pipelines for you and cover all API changes!

Enable data-driven decision-making

Empower everyone in your company with consistent and standardized data, automate data delivery and measure KPIs across different systems.