How to connect Google Ads Reporting API to Tableau

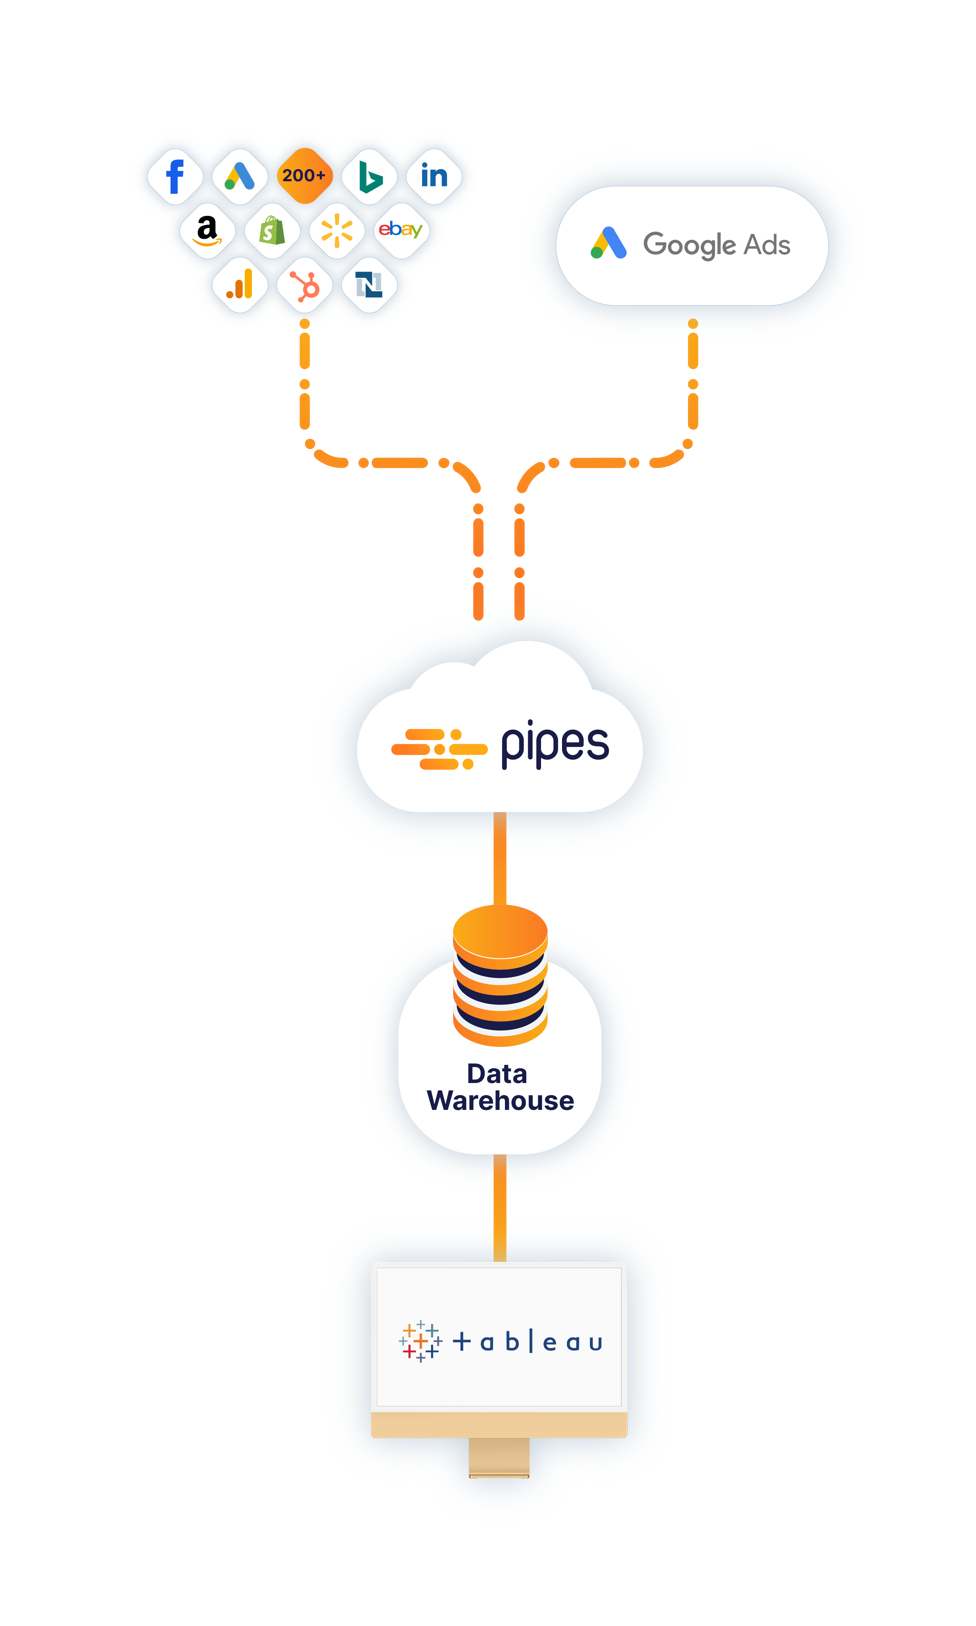
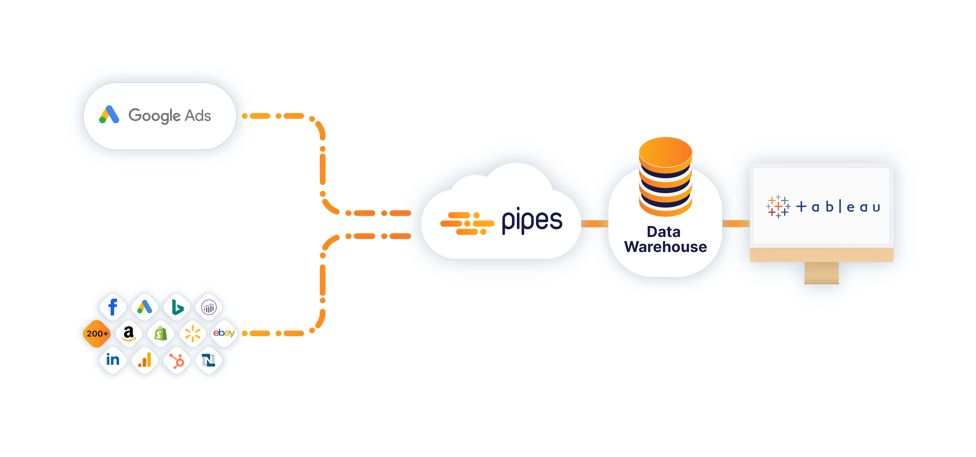
Discover how to get data from Google Ads Reporting API (and from other sources) into Tableau by locating it into your data warehouse that is connected to Tableau.
Load your Google Ads Reporting API data into your central data warehouse to analyze it with Tableau.
To analyze Google Ads Reporting API data with Tableau, Pipes provides you with fast and easy access to all your data by automatically loading it in your data warehouse. Always up-top-date, no performance issues, without writing a single line of code.
1

Connect your data warehouse

It will be the central database for your Google Ads Reporting API data. Pipes supports the most popular relational data warehouses in the cloud and on-premises.
2

Connect to Google Ads Reporting API

You just need to enter the associated credentials to allow Pipes access to the Google Ads Reporting API API.
3

Create a data pipeline

Create a pipeline from Google Ads Reporting API to your central data warehouse. The pipeline will run automatically on your defined schedule, so you will always have fresh data available.
4

Access your Google Ads Reporting API data with Tableau

Connect Tableau to your data warehouse. You will see your Google Ads Reporting API data there in form of standardized tables. Now you can analyze your data without performance issues!

About Google Ads Reporting API

Google Ads is an indispensable tool for digital marketing, harnessing Google’s vast search network to connect businesses with prospective customers. With a diverse suite of advertising options across search, display, and video, Google Ads offers unparalleled customization and targeting capabilities. Whether you’re a small startup or a large enterprise, this platform can tailor your ads to reach the right audience, driving traffic and sales through precise, data-driven campaigns. Our Google Ads connector delivers all your campaign data automatically on schedule directly into your central data warehouse. Find more information about our Google Ads data connector in the dedicated connector documentation.

About Tableau

Tableau Software produces interactive data visualization products to enhance its clients Business Intelligence activities. With Tableau products teams are enabled to quickly connect, share, and visualize their data. Tableau is able to query relational databases, OLAP cubes, cloud databases as well as spreadsheets and then generates a number of graph types.

Your benefits with Pipes

Get central access to all your data

Access data from 200+ data sources with our ready-to-use connectors and replicate it to your central data warehouse.

Automate your data workflows

Stop manually extracting data and automate your data integration without any coding. We maintain all pipelines for you and cover all API changes!

Enable data-driven decision-making

Empower everyone in your company with consistent and standardized data, automate data delivery and measure KPIs across different systems.