How to connect SendGrid to R

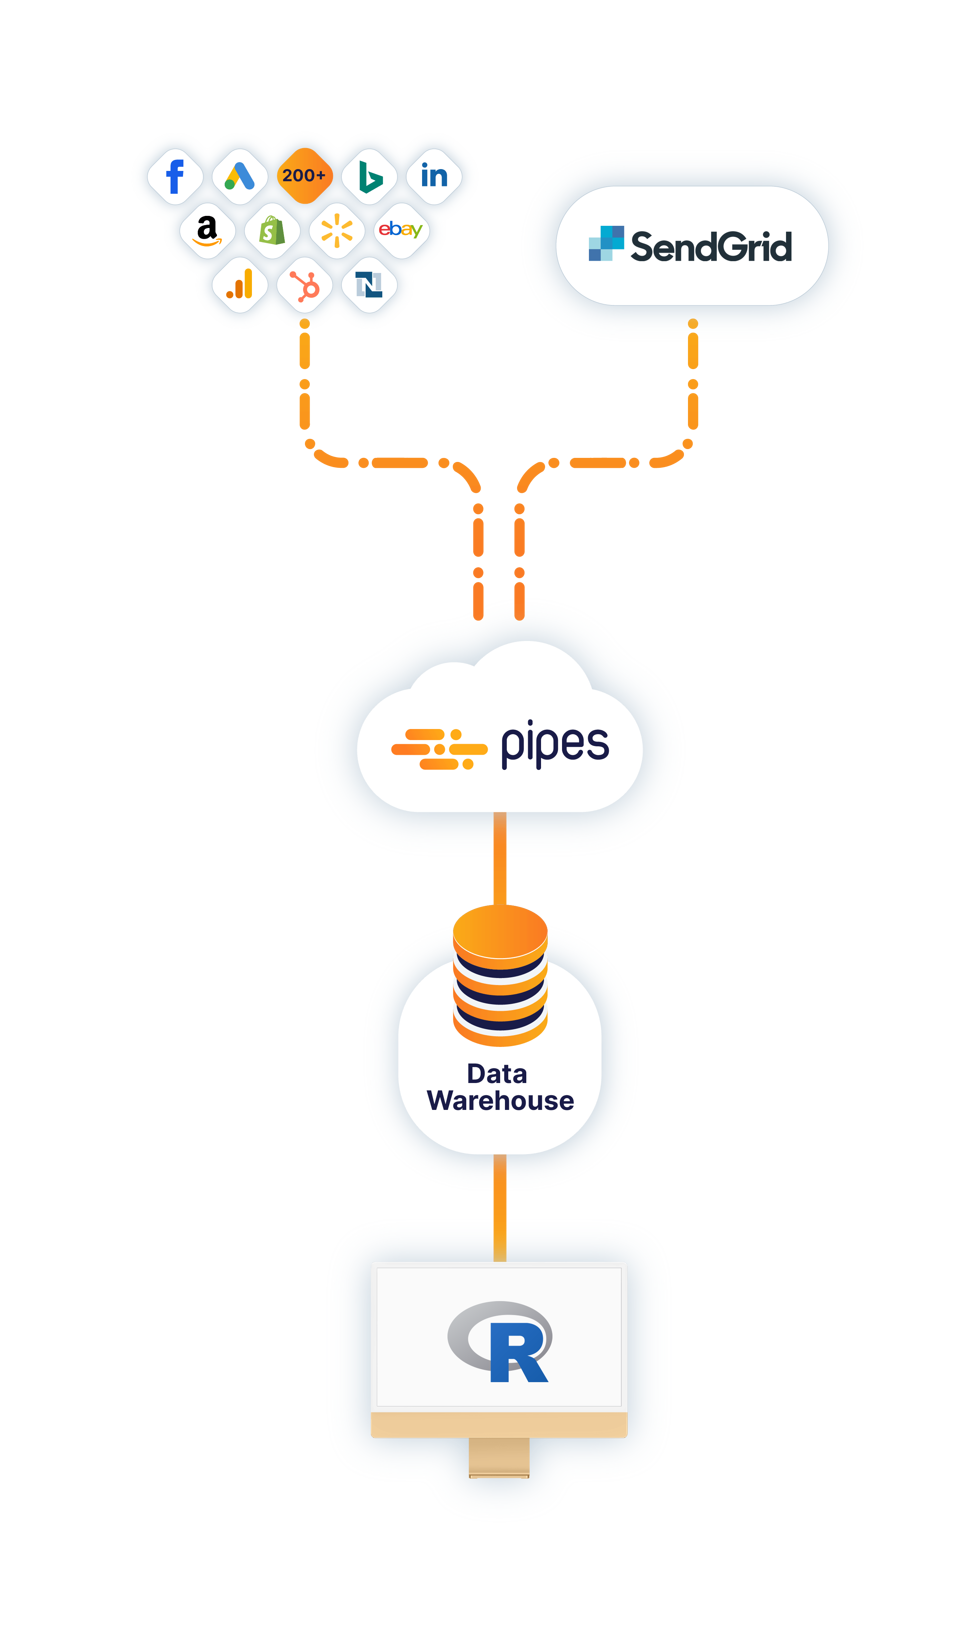
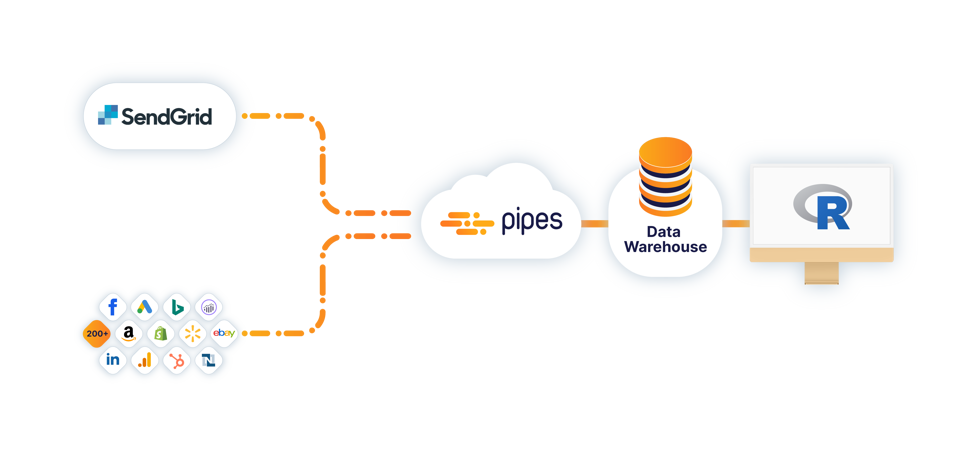
Discover how to get data from SendGrid (and from other sources) into R by locating it into your data warehouse that is connected to R.
Load your SendGrid data into your central data warehouse to analyze it with R.
To analyze SendGrid data with R, Pipes provides you with fast and easy access to all your data by automatically loading it in your data warehouse. Always up-top-date, no performance issues, without writing a single line of code.
1

Connect your data warehouse

It will be the central database for your SendGrid data. Pipes supports the most popular relational data warehouses in the cloud and on-premises.
2

Connect to SendGrid

You just need to enter the associated credentials to allow Pipes access to the SendGrid API.
3

Create a data pipeline

Create a pipeline from SendGrid to your central data warehouse. The pipeline will run automatically on your defined schedule, so you will always have fresh data available.
4

Access your SendGrid data with R

Connect R to your data warehouse. You will see your SendGrid data there in form of standardized tables. Now you can analyze your data without performance issues!

About SendGrid

SendGrid stands as a comprehensive cloud-based service, empowering businesses to deliver transactional and marketing emails with notable efficiency and high deliverability. It offers diverse functionalities, including sophisticated email tracking, analytics, and scalable solutions, aiding businesses in enhancing customer engagement and retention through effectively optimized email communications. By using Data Virtuality’s SendGrid API data connector, organizations can achieve seamless integration and easy access to their SendGrid data, enabling advanced analytic insights and automation capabilities in email campaigns. This integration allows businesses to finely tune their email communication strategies, ensuring a more customized and resonant approach, essential for navigating the intricate and competitive realm of digital marketing today.

About R

R is a software environment and programming language supported by the R Foundation for statistical computing and for statistical graphics and computing. Data miners and statisticians use the language R for developing statistical software. Source code for the R software environment is primarily written in Fortran, C, and R.

Your benefits with Pipes

Get central access to all your data

Access data from 200+ data sources with our ready-to-use connectors and replicate it to your central data warehouse.

Automate your data workflows

Stop manually extracting data and automate your data integration without any coding. We maintain all pipelines for you and cover all API changes!

Enable data-driven decision-making

Empower everyone in your company with consistent and standardized data, automate data delivery and measure KPIs across different systems.